IAT 355 - Visual Analytics - Spring 2026
Introduction to Visual Analytics
9 public projects

Pokemon Cultural Relevance Project
PublicTeam Rocket
vla83, kfa42, dla224
This project explores the history and evolution of the Pokémon franchise as a tribute to its 30-year anniversary. Through a series of interactions and data visualizations, it examines how the franchise has expanded and changed to appeal and enhance peoples’ enjoyment of the game. Together, these visualizations tell the story of Pokémon as a 30 year old evolving franchise of game design, shaped by innovation, technology, and years of development and growth.
Rating: 3.8 / 5 · 17 ratings
4/21/2026

Team High Tech IAT355 Spring2026
PublicTeam HighTech
aky6, phum, saima
We wanted to analyze the performance of the movie industry, focusing specifically on three major pop culture studios - Marvel, DC, and Pixar, based on our personal familiarity and their large generational influence. By vizualizing the data of these studios, we could answer if our feelings towards them matched their performance. Through our vizualization website, we aim to answer: -Which Genres perform the best -Which of Marvel, DC, or Pixar perform better? (Marvel vs DC debate) -How do ratings and box office revenue relate? Such answers may be of interest to casual movie-goers or diehard fans of certain studios. They can reveal whats popular, or break preconceived assumptions such as studio bias, or ratings equating to success. Changes impletmented: -Larger font (from 16px to 20px) -studio color visibility and consistency (No longer 2 shades of blue, replaced with green, and the bubble chart now follows the same color code) -Bar graph is larger
Rating: 4.1 / 5 · 17 ratings
4/21/2026

The Uneven Wave
PublicPopeyes Sandwich
sga199, Sai Arun Modekurti, Kaiyi Sun, Vithun Geetha Vinu
How AI spread through Gaming, Marketing, and Media — and what the data actually shows.
Rating: 4.7 / 5 · 14 ratings
4/21/2026

Delivered: What The Data Says About How We Eat
PublicTeam Big Backs
rtn1, Riley Nakano, Kayla Wong, Kal Kuan Chia
Rating: 4.4 / 5 · 13 ratings
4/21/2026

Dead Internet - Reddit
PublicVancouver Canucks
tka73, Shamikh Rahim, Isabel Garcia
Our project focuses on the concept of the Dead Internet Theory, which suggests that a large portion of online activity is now generated by automated bots rather than real people. The project will analyze patterns in online activity and explore whether differences between bot-generated and human-generated content can be identified through data visualization. We will focus specifically on comment activity from the platform Reddit, where automated accounts and human users often interact within the same discussions.
Rating: 4.7 / 5 · 11 ratings
4/21/2026

Every AI Query Has a Carbon Cost
PublicCorina Chen
corinac
This project makes the invisible CO2 cost of using AI visible, so user can understand the impact of your daily AI use and make a more deliberate choice.
Rating: 4.5 / 5 · 13 ratings
4/20/2026
Youtube Trending Analysis
PublicSilver in League
hca171, tca166, pla127
This project explores YouTube trending data from 2020 to 2024, analyzing which genres dominate the platform, how viewer engagement has evolved, and what the numbers reveal about audience behavior at scale.
Rating: 3.1 / 5 · 11 ratings
4/20/2026

TikTok Vs Spotify
PublicGroup 1
hkrstovi, Alexander Krstović, Vuth Sethi, Sukhman Sran
TikTok vs Spotify is a data visualization website that explores whether TikTok virality translates into Spotify streaming success. The problem it addresses is a widely held assumption in the music industry that going viral on TikTok leads directly to chart performance on Spotify. Using a dataset of 4,000 songs from 2024, the project visualizes the relationship between TikTok activity and Spotify streams across multiple chart types.
Rating: 4.7 / 5 · 15 ratings
4/20/2026
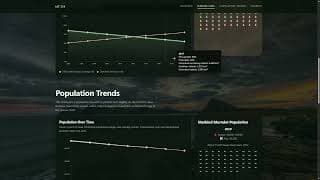
Marbled Murrelet Habitat + Population in British Columbia
PublicTeam Silver In Valorant
sunwoo (jsn11), Joshua Nam, Jenna Han, Rico Wen
Rating: 4.2 / 5 · 14 ratings
4/20/2026